Why do I have a high number of Users and Abandons on my form?
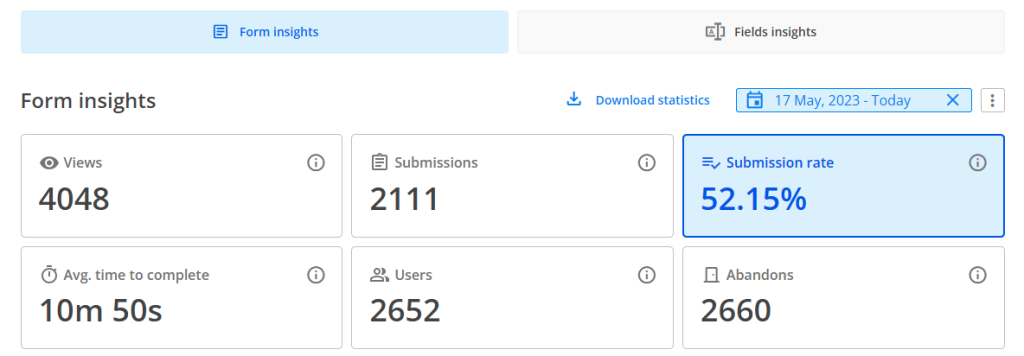
You’ve published your form and you have started to gather Insights data. But you’ve noticed that you have a high number of Users and Abandons on your form and the numbers do not add up. Let’s see what you should keep in mind when interpreting Insights data.

Browser cookies
As a general rule, Users logs in unique respondents, but under certain scenarios. Firstly, we track a “unique respondent” via their browser. If they change their browser or device, they will count as a “new user”.
Further, if the respondent uses the same browser each time they interact with the form AND their browser has cookies allowed, then we can easily track that the same respondent accesses the form three times. So we log in only one user.
If the browser does not have cookies allowed, then we can not track down the identity of that respondent. Therefore we will count the user as a unique one each time he accesses the form, even from the same browser.
Another stat that is dependent on browser cookies is Abandons. Normally, when a visitor opens the form and starts interacting with it, we automatically apply 1 Abandon, which we later delete once they submit. But with cookies disabled, we’re not able to track that correctly anymore so the abandon number remains.
This is one of the main reasons why you might register a high number of users and abandons.
All cookies enabled/ Third-party cookies blocked
When your respondents have no cookies blocked, or only the third-party cookies blocked, your Insights data will behave the same. This means that if your respondent accesses the form three times from the same device and browser, we are counting only one user.
Let’s detail what happens on each step when the same respondent accesses the form numerous times:
Step 1: respondent A accesses the form the first time, interacts with the form but does not submit it. This results in 1 view, 1 user, 0 submission, 1 abandon.
Step 2: same respondent A accesses the form the second time, interacts with the form, but does not submit it. This results in 1 view, 0 user, 0 submission, 1 abandon.
Step 3: same respondent A accesses the form the third time, interacts with the form and now submits it. This results in 1 view, 0 user, 1 submission, 0 abandon.
After all the actions from above, if we draw the line, our Insights data would show: 3 views, 1 user, 1 submission, 2 abandons.
Above we talked about the situation when your form respondents do not finish filling out the form in one sitting. Now let’s explain what happens when your form respondents are different each time (or they are the same but access the form from different devices or browsers each time).
Using the steps structure from above, this is what happens in this scenario:
Step 1: respondent A accesses the form, interacts with the form but does not submit it. This results in 1 view, 1 user, 0 submission, 1 abandon.
Step 2: respondent B accesses the form, interacts with the form, but does not submit it. This results in 1 view, 1 user, 0 submission, 1 abandon.
Step 3: respondent C accesses the form, interacts with the form and submits it. This results in 1 view, 1 user, 1 submission, 0 abandon.
After all the actions from above, if we draw the line, our Insights data would show: 3 views, 3 users, 1 submission, 2 abandons.
All cookies blocked
There might be cases in which your respondents have both browser cookies and third-party cookies blocked.
In this case, Users will increase with each time a respondent accesses the form. We cannot track down if it is the same respondent, even if he is using the same browser/device. Each time your respondents access the form, interact with it and do not submit it, we are counting 1 view, 1 user & 1 abandon.
Furthermore, even if your respondent submits the form, because of the blocked cookies, we are still keeping the abandon value that allocated. This results in an Insights section that will have very similar numbers for Submissions, Users and Abandons.
Views & Submissions
While Users & Abandons are dependent on browser cookies & third-party cookies, the number of Views & Submissions will always be accurate.
Views & Submissions are not impacted by cookies being disabled or enabled. Submission rate is based on these two metrics, thus these three Insights stats are accurate even if your respondents do not allow cookies.
Related articles
Similar Articles
Frequently Asked Questions
Here is a list of the most frequently asked questions. For more FAQs, please browse through the FAQs page.